Table of contents
- What is Customer Effort Score?
- How to calculate Customer Effort Score
- Two CES scales that run in opposite directions
- What counts as a good Customer Effort Score
- When to send a CES survey
- How to write the question so the data holds up
- What to do with a low score
- The most common CES measurement mistakes
- CES vs NPS vs CSAT
- How to run CES in Responsly
- Summary

Customer Effort Score (CES) is the metric that measures how much work a customer had to do to get their problem solved. This guide is for support, product and CX teams that need to know not just whether customers are satisfied, but where a process is costing them too much. We cover the formula with a worked example, the two CES scales that run in opposite directions, the timing window that decides whether the data is usable at all, and how to break a low score down into concrete steps you can remove.
What is Customer Effort Score?
CES measures ease, not happiness. It asks one thing: how much work did the customer have to do to reach their goal — resolve an issue, finish a purchase, find an answer.
The most common form of the question is:
“To what extent do you agree with the following statement: the company made it easy for me to handle my issue.”
Respondents answer on a scale from 1 to 7, where 1 is strong disagreement and 7 is full agreement. It sits alongside the other customer service metrics, but answers a question none of the others do.
Where the metric came from
CES was not invented as another dashboard number. It was a rebuttal to the prevailing belief that service should delight customers. Matthew Dixon’s team showed that trying to exceed expectations rarely increases loyalty, while reducing the effort required to get something done has a far stronger effect — Stop Trying to Delight Your Customers, Harvard Business Review, 2010.
The same research produced the most-quoted finding on effort and loyalty: customers whose service interaction cost a lot of effort overwhelmingly became disloyal, while low-effort interactions rarely produced that outcome. The argument was expanded in The Effortless Experience (Matthew Dixon, Nick Toman, Rick DeLisi, Portfolio/Penguin, 2013), which is where today’s version of the metric comes from.
How to calculate Customer Effort Score
The score is the arithmetic mean of all ratings.
Example: 100 responses, and the sum of ratings on a 1–7 scale is 580.
A score of 5.8 out of 7 means customers broadly agree that it was easy. Higher means less effort — under this scale convention. And that is where the problem almost nobody writes about begins.
Two CES scales that run in opposite directions
Two variants of the question are in circulation, and they point opposite ways.
| Variant | Question | Scale | Better score |
|---|---|---|---|
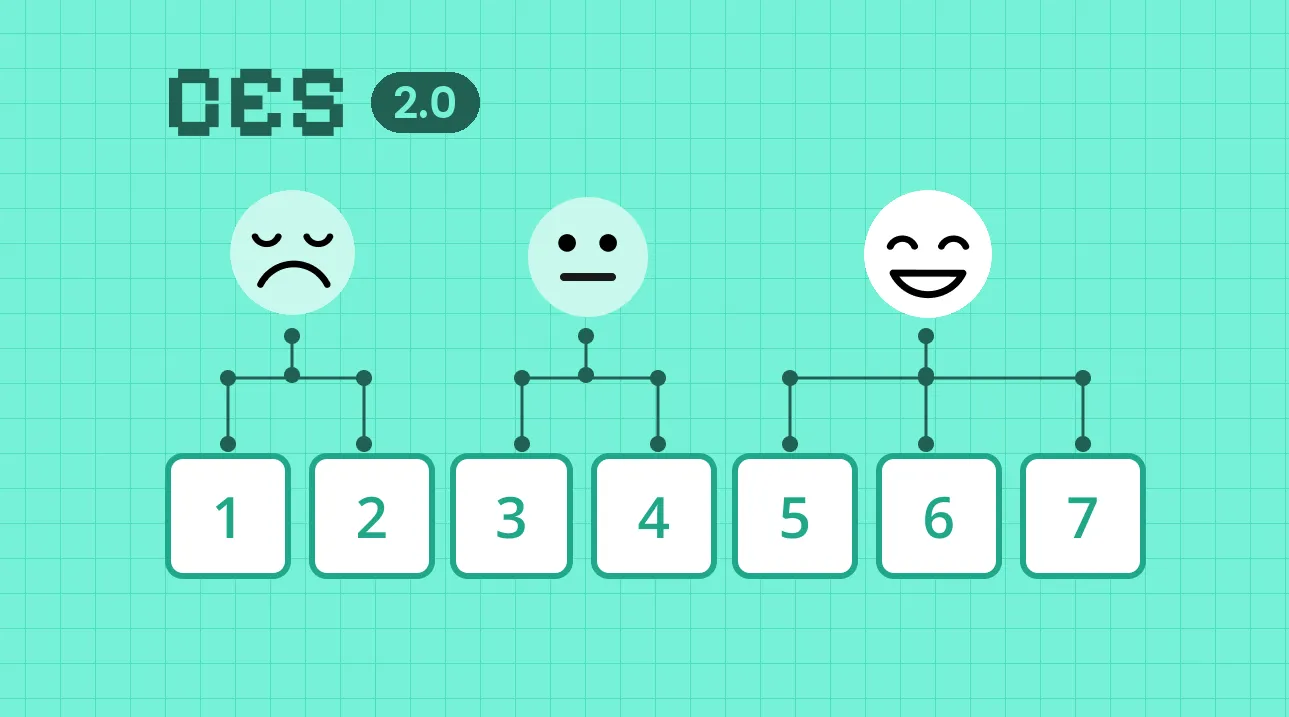
| CES 2.0 (current standard) | “The company made it easy to handle my issue” — level of agreement | 1–7 | higher |
| CES 1.0 (older) | “How much effort did you personally have to put forth?“ | 1–5 or 1–7 | lower |
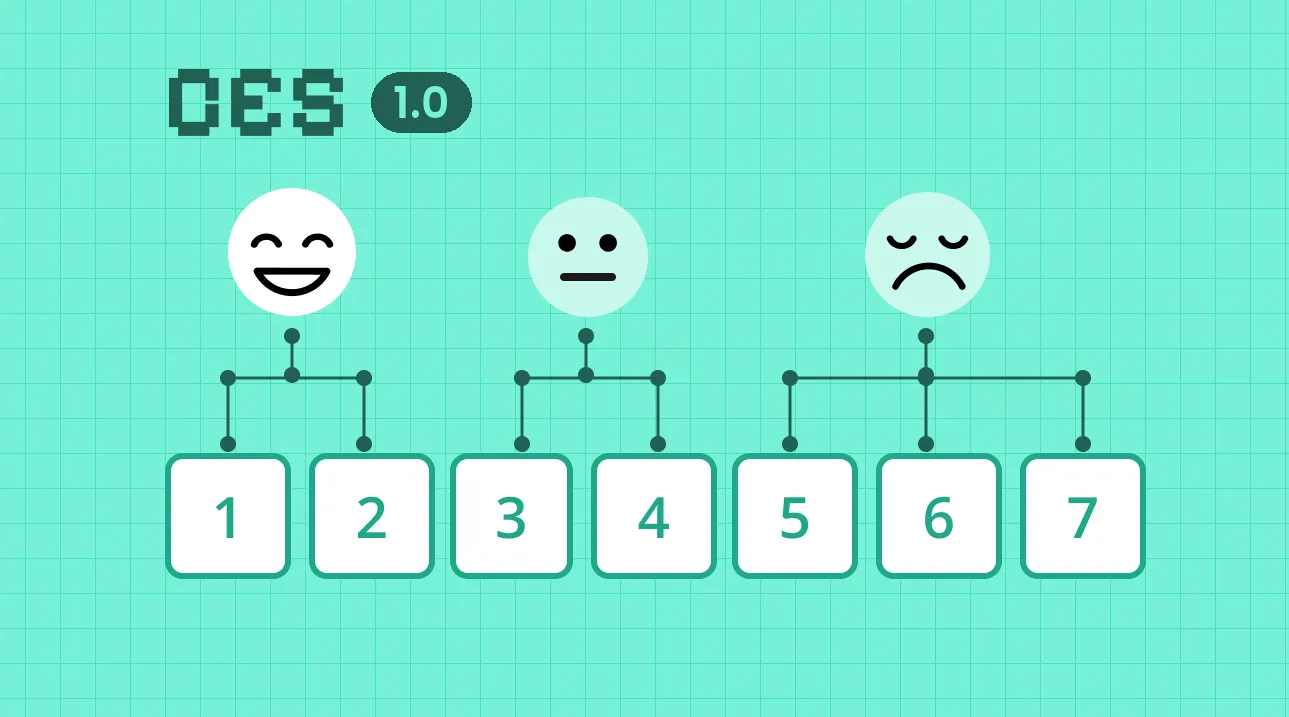
This is not an academic nuance. If a team rewords the question between quarters, or two departments use different variants, the trend inverts with nothing having changed in reality. A reported “improvement from 2.1 to 5.6” is far more often a rewritten question than a fixed process.
The practical rule: pick a variant once, record it in the study documentation next to the scale and thresholds, and state which convention you are using in every report. The number on its own is unreadable without it.
What counts as a good Customer Effort Score
On the 7-point agreement scale, above 5 is generally healthy and below 4.5 is worth investigating. Treat those bands loosely, because CES is barely comparable between companies.
Three things account for that:
- Question wording. Even a small change in phrasing shifts the distribution of answers.
- Timing. A survey sent after an hour and one sent after a week measure different things, which we come to next.
- Type of process. A complaint inherently costs more effort than a one-click repeat purchase. Comparing the score for complaints with the score for checkout tells you nothing about the quality of either.
The only honest reference point is your own previous measurement of the same process, with the same question, on the same scale. Industry benchmarks are useful for sanity-checking the order of magnitude, not for holding a team to account.
When to send a CES survey
Effort is remembered precisely for hours, not weeks. This is the one experience metric where a delayed send destroys the measurement quickly, because customers remember the outcome far longer than the path to it. After a week they remember that the issue was resolved — not that it took three messages to get there.
Trigger the survey on the event that closes the process, never on a schedule:
- Ticket resolution — within an hour of the issue being closed, ideally through live chat surveys where the conversation happened.
- Purchase or payment — right after checkout completes, to judge the buying flow.
- Onboarding completion — after the first unaided use of the product, not after the account is created.
- Returns and claims — after the case closes, since this is the process with the highest natural effort.
Sample size matters as well. With a dozen responses a single extreme rating moves the average by half a point, so a trend only becomes readable somewhere above a few dozen responses per process. For low-volume flows, compare quarters rather than weeks — otherwise you are reacting to noise.
And do not ask about effort where there was none. A survey after a routine login collects nothing but sevens and dilutes everything else.
How to write the question so the data holds up
CES is more sensitive to wording than NPS or CSAT, because it measures a feeling customers do not usually name themselves.
Ask about the task, not the company. “The company made it easy for me to handle my issue” works better than “Was our support helpful?”, because it points at the customer’s goal rather than at your staff. Rating the agent is a different metric.
Label both ends of the scale. Bare numbers from 1 to 7 leave too much to interpretation. Write “strongly disagree” and “strongly agree” on the ends, or a share of respondents will read the scale backwards.
Keep one open question and stop there. The customer has just finished dealing with you; every extra question costs responses. The rating plus an optional “what was hardest?” is the whole survey.
Do not lead. Phrasings like “did our fast support make it easy for you?” lift the score and break comparability with your previous measurement.
Leave the wording alone. Improving the question “for clarity” halfway through a series produces a number that cannot be compared with anything before it — and nobody remembers that was the cause of the jump six months later.
What to do with a low score
The headline number rarely leads to a decision on its own: it says friction exists, not where. Breaking the score down is what turns it into work.
A practical order of work:
- Segment it by channel, issue type, team and plan. A company-wide average almost always hides one process dragging the rest down.
- Read the open answers from the worst segment. That is where “had to repeat myself” and “could not find it” appear — each one a concrete step to remove. At volume, sentiment analysis of those answers makes this tractable.
- Remove one thing — the most frequently named step, not everything at once.
- Measure again once a comparable sample has arrived, using the same question and threshold. Several simultaneous changes make the result unreadable.
The common causes of high effort are repeatable: forcing customers to switch channels, making them repeat their story to successive agents, self-service that does not actually answer the question, and processes with more steps than the customer expected.
It is also worth checking whether a low score comes from one period rather than one process. A release, a seasonal peak or a short-staffed team can depress the average for a few weeks and then recover on its own. Plotting the score against a timeline separates a structural problem from a temporary one — and saves work fixing something that already passed.
The most common CES measurement mistakes
- Sending on a schedule instead of an event. A weekly batch reaches customers who closed their case five days ago and no longer remember it.
- One score for the whole company. Customer Effort Score works as a ranking of processes. A single number averages complaints together with purchases and says nothing about either.
- Measuring processes that cost no effort. A survey after a routine login or an opened newsletter collects high ratings that dilute everything meaningful.
- Ignoring the open answers. The rating says friction exists. Only the comment says where it sits.
- Moving the threshold mid-series. Shifting what counts as a “good” score changes the report without changing reality — exactly like changing the scale.
- Rating the agent instead of the process. “Was the agent helpful?” measures a person; CES is supposed to measure the path. Mixing them makes the score unusable for fixing the process.
CES vs NPS vs CSAT
The three metrics answer different questions and work best together.
| Metric | What it measures | Question | When to ask |
|---|---|---|---|
| CES | Customer effort | ”The company made it easy to handle my issue” | Right after a process or support contact |
| CSAT | Satisfaction with one interaction | ”How satisfied were you?” | Right after the event |
| NPS | Loyalty and willingness to recommend | ”How likely are you to recommend us?” | Periodically, at relationship level |
The practical difference matters: a customer can be satisfied with the outcome and still exhausted by the process. CSAT will report that as fine; CES surfaces the risk.
How to run CES in Responsly
A CES survey is one question, so building it is not the hard part. Triggering it at the right moment and getting something out of the open answers is.
The CES software page carries the ready-made setup: the scale in the correct convention, an open question under the rating, and event triggers on ticket closure, order completion or the end of onboarding. Responses land straight in analysis, where Athena groups comments into recurring themes and shows which of them is pulling the score down hardest.
The fastest start is the CES survey template — swap the process name and connect the trigger.
Summary
Customer Effort Score is the cheapest experience metric to launch: one question, one moment, one owner. Its value comes not from the number itself but from three decisions around it — which scale convention you use, when you send the survey, and how you segment the result.
Start with a process you already suspect, measure it properly, and remove one step. That is usually enough to convince a team that CES is not another reporting metric but a list of things to fix.
FAQ
What is a good Customer Effort Score?
Which CES scale should I use, 5-point or 7-point?
When should I send a CES survey?
How is CES different from NPS and CSAT?
Does CES predict churn?
Is the rating question enough on its own?
Tagged in
Last updated